![]()
Important: As of the fall of 2016, the Department of Health and Human Services (HSS) suspended the HAvBED program. These features are still available in EMResource so you may continue to use them for data aggregation purposes.
EMResource's HAvBED features provide you with the tools you need to aggregate statewide bed availability data. This can be useful when running an internal exercise or to support State or local disaster response efforts.
EMResource logs each instance of data aggregation and you can easily access this information.
Refer to the following sections to learn about key elements of HAvBED reporting, setup fields, resource reporting options, and more.
Key Elements
To ensure successful bed availability reporting, your region must set up certain key elements, as follows:
Status Types, mapping - A regional administrator can view how status types included in HAvBED data are mapped to standard HAvBED reporting categories (Standard Status Type).
Status Type, event-related - If you choose to expose your HAvBED data through a view, your related status types should not be specified as event only. If you only expose the data through an event, they should be marked as event only. Refer to Reporting Options for more information.
Resources - Each resource that you want to have report their bed availability must have the Reports HAvBED data check box selected. In most cases, these resources are hospitals, but you can select this setting for any of your region's resources. The setting allows you to engage any resource in HAvBED reporting for State and local purposes.
Note: The system aggregates and displays data for only those resources that have the Reports HAvBED data setting selected.
Reporting Options
A region generally sets up a HAvBED reporting structure in one of the following ways:
View
Event
Your region then uses this structure to view, enter, and update its HAvBED counts and related information.
In addition, all such status types are available when viewing the resource's detail page.
View
Your region may choose to set up a view specifically for HAvBED reporting. In the following example, the regional administrator created the following view.

This page shows the count each HAvBED resource reported in the indicated categories. When a resource updates one of their HAvBED statuses, this page reflects the change.
Event
Episodic events are the most common data collection tools for HAvBED data. As such, your administration may collect this data via events. You can do any of the following:
Aggregate this data from an event, such as an MCI or severe weather event.
Run a HAvBED event once a month or every week in order to collect this data.
Set up a never-ending event specifically for HAvBED reporting.
In the following example, the regional administrator created the HAvBED Query event. This event appears in a black event banner at the top of the user's EMResource page. Clicking the banner opens the Event Status page.
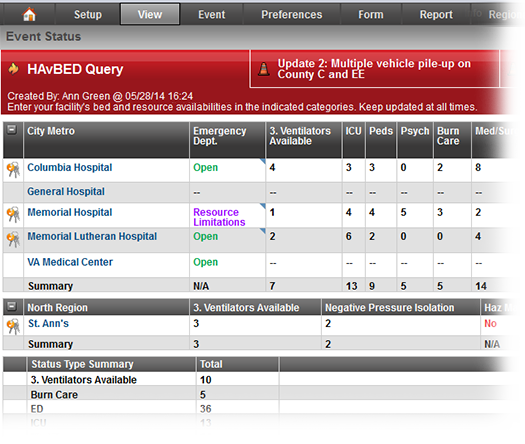
This page shows the count each HAvBED resource reported in the indicated categories. When a resource updates one of their HAvBED statuses, this page reflects the change.
History
EMResource logs and retains your history of generating HAvBED data.
Summary
The HAvBED Reporting History page shows the summary for each date on which an authorized user took a "snapshot" of your data. The table shows each HAvBED category and the number reported in each at the date/time of the snapshot.
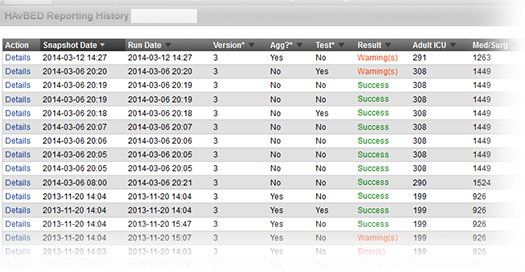
Tip: Some columns in the table contain an asterisk (*) in the column header. Scroll to the bottom of the page to view definitions of these categories.
Details
Click Details in the Action column to view all the data in the snapshot. The top of the HAvBED Report Detail page shows the snapshot Summary.
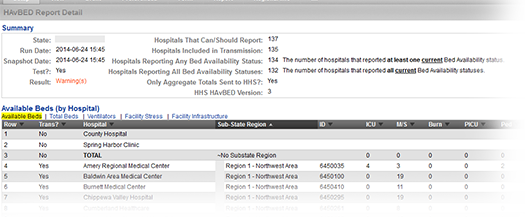
The following table lists descriptive information about fields and sections in the Detail page:
Field / Section | Description |
|---|---|
State | Indicates your State's name (which may not be the same as our region's name). |
Run Date and Snapshot Date | For on demand (immediate) snapshots, these are the same; the Snapshot Date differs when you specify a date in the past for the snapshot. |
Test | Indicates whether the data was submitted to HHS (Test = No) or was generated without sending to HHS (Test = Yes). |
Result | Data was submitted without issue (Success), submission occurred with exceptions (Warning), submission occurred but was rejected by the HHS server (Errors), or the submission process failed (Fail). To determine the actual outcome, scroll down to the Error Messages & Warnings section at the bottom of the page. This table shows the issues (if any) that occurred during the snapshot. You can also tell from this information whether the data was sent to HHS. |
Metrics | Fields and numbers on the right side of the Summary pane show a number of metrics that may be useful to you, including the number of resources that indicated they are reporting HAvBED data (Hospitals That Can/Should Report), the number of hospitals included in the transmission, and the number of those resources that actually submitted data. Reported data appears in tabs in the Available Beds (by Hospital) section, such as Available Beds, Total Beds, and more. Each resource is a row in the table. Click a tab header to view that data. |