![]()
eICS provides easy access to active incidents through the Home page. Scroll through the Home - Active Incidents list to find the one you want to view, and then click View in the first column to open its dashboard.
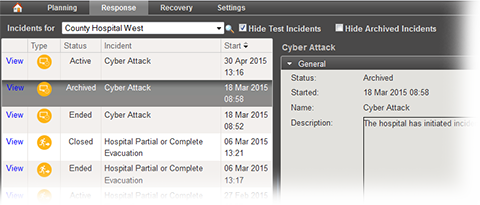
In addition, you can access both active and inactive incidents by pointing to Response and clicking Incidents. At the top of the page, select the appropriate facility. The page shows the selected facility's active and inactive incidents on the left.
Dashboard
Managing an incident can involve many types of tasks. Related tasks are grouped and available via the tabs on the Incident Dashboard. For more information, refer to About the Incident Dashboard.
Activation Processes
When you set up an incident and click Activate Incident, several background processes are initiated, including sending notifications and setting up the incident library. If these processes are still running when the new dashboard opens, a banner at the top provides up-to-the-second information on the system's progress in these areas.
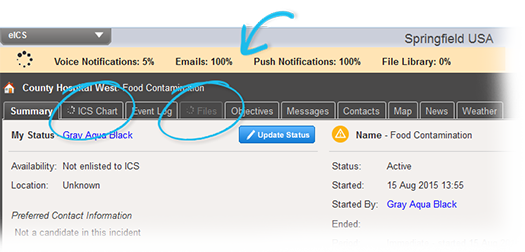
While processes run, the progress spinner icon appears in the banner and in the tabs that are still processing. You can open the ICS Chart tab while the spinner is present, but the information will be incomplete until Voice Notifications, Emails, and Push Notifications reach 100%. The Files tab is not available until the file library setup is 100% complete.
When all background processing is done, the progress banner closes.
Escalation
eICS provides the tools you need to escalate an incident when events or situations cause it to expand beyond the scope of the current response efforts. For more information, refer to Incident Escalation.