- Created by Carl Brown, last modified on Jan 08, 2019
You are viewing an old version of this page. View the current version.
Compare with Current View Page History
« Previous Version 7 Next »
![]()
Saturation Scores allow hospitals to calculate the degree of saturation or overcrowding in their Emergency Departments (EDs) so that the facility can accurately communicate its availability.
The basic Saturation Scoring tool employs several key inputs related to the ED, including capacity, volume, and acuity of patients in the ED. EMResource offers a second saturation scoring tool, the National Emergency Department Overcrowding Score (NEDOCS). NEDOCS takes into account ED capacity and the acuity of current patients. However, NEDOCS also uses ED throughput to inpatient beds as a key component to the calculation. Both options are available in the list of available Status Types.
NEDOCS
NEDOCS "is the global standard for measuring patient throughput" (NEDOCS), helping hospitals measure capacity and reduce overcrowding. This saturation score takes a variety of factors into account, including the number of ED patients, beds, and admissions, as well as ED throughput.
Form and View Pages
When you update a NEDOCS status, the system asks you to enter numbers in seven fields. To get an accurate calculation, you must enter a number in each field. After you add a number to the last field, click Calculate to get the score.

Once you enter values in the Number of ED beds field for a hospital, the system retains that information and makes it available the next time you update this status. You can opt to change this element, as necessary and appropriate.
Note: The system assumes that the questions are being answered based on current conditions and will automatically note the date and time the information is being provided.
Once computed and saved, the calculated score can appear in View and details pages. If the Reset Value (Reset value upon expiration?) option is selected for the status type, the system displays expired saturation scores as dashes.

You have a number of options when configuring a saturation score status type. Notice that the scores in the example above are color coded.
Scale
The following table shows the scale for NEDOCS. By default, these ranges have already been color coded to aid your users in quickly detecting the current level of overcrowding. The calculated score appears on the appropriate View and details pages in the color specified for that score.
The score also shows a brief description, such as 144 - Severe. Your organization may have opted to remove these descriptive labels. In these cases, the score appears and is color coded, but there is no associated descriptive label.
Scale | Definition | Default Color in EMResource | Default Label |
|---|---|---|---|
0-20 | ED is not busy | Green | Normal |
21-60 | ED is busy | Blue 21-50 (Normal) 51-60 (Busy) | Busy |
61-100 | ED is extremely busy but not overcrowded | Yellow | Busy |
101-140 | ED is overcrowded | Purple | Overcrowded |
141-180 | ED is severely overcrowded | Red | Severe |
181 and higher | ED is dangerously overcrowded | Black | Disaster |
Fields and Calculation
Your existing data appears in the two fields on the right. EMResource uses this, plus data in the following fields, to calculate your NEDOCS. You need to determine the following values to enter on the NEDOCS form.
Calculation
NEDOCS = 85.8(C/A) + 600(F/B) + 13.4(D) + 0.93(E) + 5.64(G) - 20
Field in Form | Description | |
|---|---|---|
A | Number of ED Beds | Total number of ED beds available or staffed, including hallways and chairs |
B | Number of Inpatient Beds | Total number of inpatient beds (excluding PEDS and OB) |
C | Number of ED Patients | Total number of ED patients, including hallways, chairs, admissions, and waiting room |
D | Number of Critical Care Patients (in ED) | Total number of critical care patients in the ED (1:1 ratio, ventilators, psych, or ICU patients) |
E | Longest ED Admit (in hours) | Longest admission time waiting in the ED; 15 minute increments; example: enter 2.25 for 2 1/4 hours |
F | Number of ED Admits | Total number of ED admissions waiting in the ED (that is, waiting for an inpatient bed) |
G | Last Door-to-bed Time (in hours) | Door-to-bed time for the last ED patient to get a bed; 15 minute increments; example: enter 2.25 for 2 1/4 hours |
When all of the appropriate elements have been entered, click Calculate to get your NEDOCS saturation score:

You can continue to change values in the form and recalculate the score. Click Save to retain your currently entered values.
Note: If the calculation results in a negative number, the score is considered to fall in the Normal / ED is not busy range and is labeled as such.
More About NEDOCS
NEDOCS was developed by Weiss, et al. and published in the Academy of Emergency Medicine in January 2004. "Results of a five-question reduced model are valid and accurate in predicting the degree of overcrowding in academic centers." [Weiss, SJ, et al., Acad of Emerg Med, 2004 Jan; 11 (1): 38-50]
"The authors hypothesize that a previously developed site-sampling form for academic ED overcrowding is a valid model to quantify overcrowding in academic institutions and can be used to develop a validated short form that correlates with overcrowding." [Weiss, SJ, et al., Acad of Emerg Med, 2004 Jan; 11 (1): 38-50]
Basic Saturation Score
The saturation score is a standard score that measures the percentage of total capacity for an emergency department (ED). It takes a variety of factors into account, including the size of the ED. Therefore, EDs of various sizes can use this same form and the
saturation percentage is adjusted appropriately.
Form and View Pages
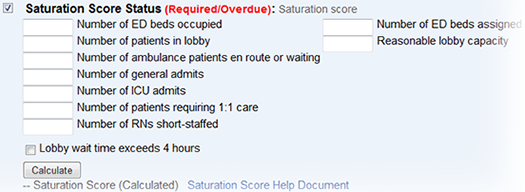
When a user updates the saturation score, the system asks the user to enter responses to eight queries. To get an accurate calculation, you must enter a number in each field. Click Calculate to get the score.

Once you or another user initializes (enters values in) the two fields on the right (Number of ED beds assigned and Reasonable lobby capacity) for a hospital, the system retains that information. You can opt to change these two capacity elements, as necessary and appropriate.
Note: The system assumes that the user is entering data based on current conditions and will automatically note the date and time the information is being provided.
Once computed and saved, the calculated score can appear in View pages. If the Reset Value (Reset value upon expiration?) option is selected for the status type, the system displays expired saturation scores as dashes.

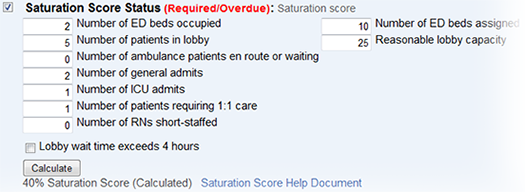
You have a number of options when configuring a saturation score status type. Notice that the scores in the example above are color coded.
Scale
If an emergency department has a saturation score of:
0% saturation score — ED is unoccupied
50% saturation score — ED is running at about half of its total capacity
100% saturation score — ED is running at capacity
>100% saturation score — ED is running above capacity
Fields and Calculation
The system supplies your existing data for the two fields on the right side of the page. You can change these two capacity elements as necessary and appropriate.
Existing Information | Description | |
|---|---|---|
1 | Number of ED beds assigned | Number of beds in department that are regularly staffed; do not include overflow hall beds unless they are regularly staffed |
2 | Reasonable lobby capacity | Number of patients your lobby can hold under normal conditions; usually about 50% of assigned beds |
The system uses the sum of 1 and 2 above as the denominator for the total saturation score calculation. |
EMResource uses the data in 1 and 2 above in conjunction with the data you enter in the following fields to calculate your Saturation Score. You need to determine the following values for entry into the saturation score form.
Calculation
Saturation Score = (A + B + C + D1 + (D2 * 2) + (D3 * 3) + (+2 if E = yes) + F) / (1 + 2)
Field in Form | Description | |
|---|---|---|
A | Number of ED beds occupied | Actual number of beds occupied in the ED at the current time |
B | Number of patients in lobby | Number of patients (not including visitors) who are currently waiting in the lobby |
C | Number of ambulance patients en route or waiting | Include patients who are on the way to this hospital or have already arrived via EMS and are waiting to be turned over to facility staff; do not include patients already counted as being in the lobby |
D1 | Number of general admits | Number of patients waiting in the ED to be admitted; do not include ICU patients or patients requiring one-on-one care |
D2 | Number of ICU admits | Number of patients waiting in the ED for intensive care bed admission |
D3 | Number of patients requiring 1:1 care | Number of patients requiring dedicated one-on-one nursing care; do not include patients included in ICU patient count |
F | Number of RNs short-staffed | Number of nurses the ED is down from normal staffing level |
System uses the number of nurses you are short-staffed in the calculation as follows:
When the number of assigned ED beds is greater than 15, you cannot add the next 5 points until you reach the next full amount of nurses you are short-staffed. | ||
E | Lobby wait time exceeds 4 hours | Patient experiences a lobby wait time of greater than 4 hours |
When all of the appropriate elements have been entered, click Calculate to get your score:

You can continue to change values in the form and recalculate the score. Click Save to retain your currently entered values.
- No labels